1
Before
Clarifying the clinical question
We first decide whether brain mapping is truly likely to add value and what question it is meant to help clarify at this point in the child’s pathway.
Brain mapping can help the team observe certain functional patterns related to regulation, attention, timing, and therapeutic readiness. It is used carefully, explained clearly, and never presented as a substitute for diagnosis or neurological care.
It is one part of an evaluation, not the whole answer.
Its purpose is to support understanding and personalization.
Results only make sense alongside history, observation, and other assessments.
This educational interface is designed for families and partners who want a clearer explanation than a technical report alone can provide.
Interactive clinical explainer
Frontal timing and state regulation
This view helps clinicians think about self-regulation, initiation, readiness, and how the child maintains a workable state for therapy and learning.
The process is structured to remain clinically useful, emotionally readable, and well integrated with broader evaluation work.
Before
We first decide whether brain mapping is truly likely to add value and what question it is meant to help clarify at this point in the child’s pathway.
During
The recording process is organized to be as calm and practical as possible, with explanation for parents and realistic expectations around the child’s tolerance.
Analysis
Results are interpreted alongside developmental history, listening findings, functional presentation, family concerns, and therapeutic priorities.
After
Families receive clear language about what the mapping may suggest, what remains uncertain, and how, if at all, it influences the therapeutic plan.
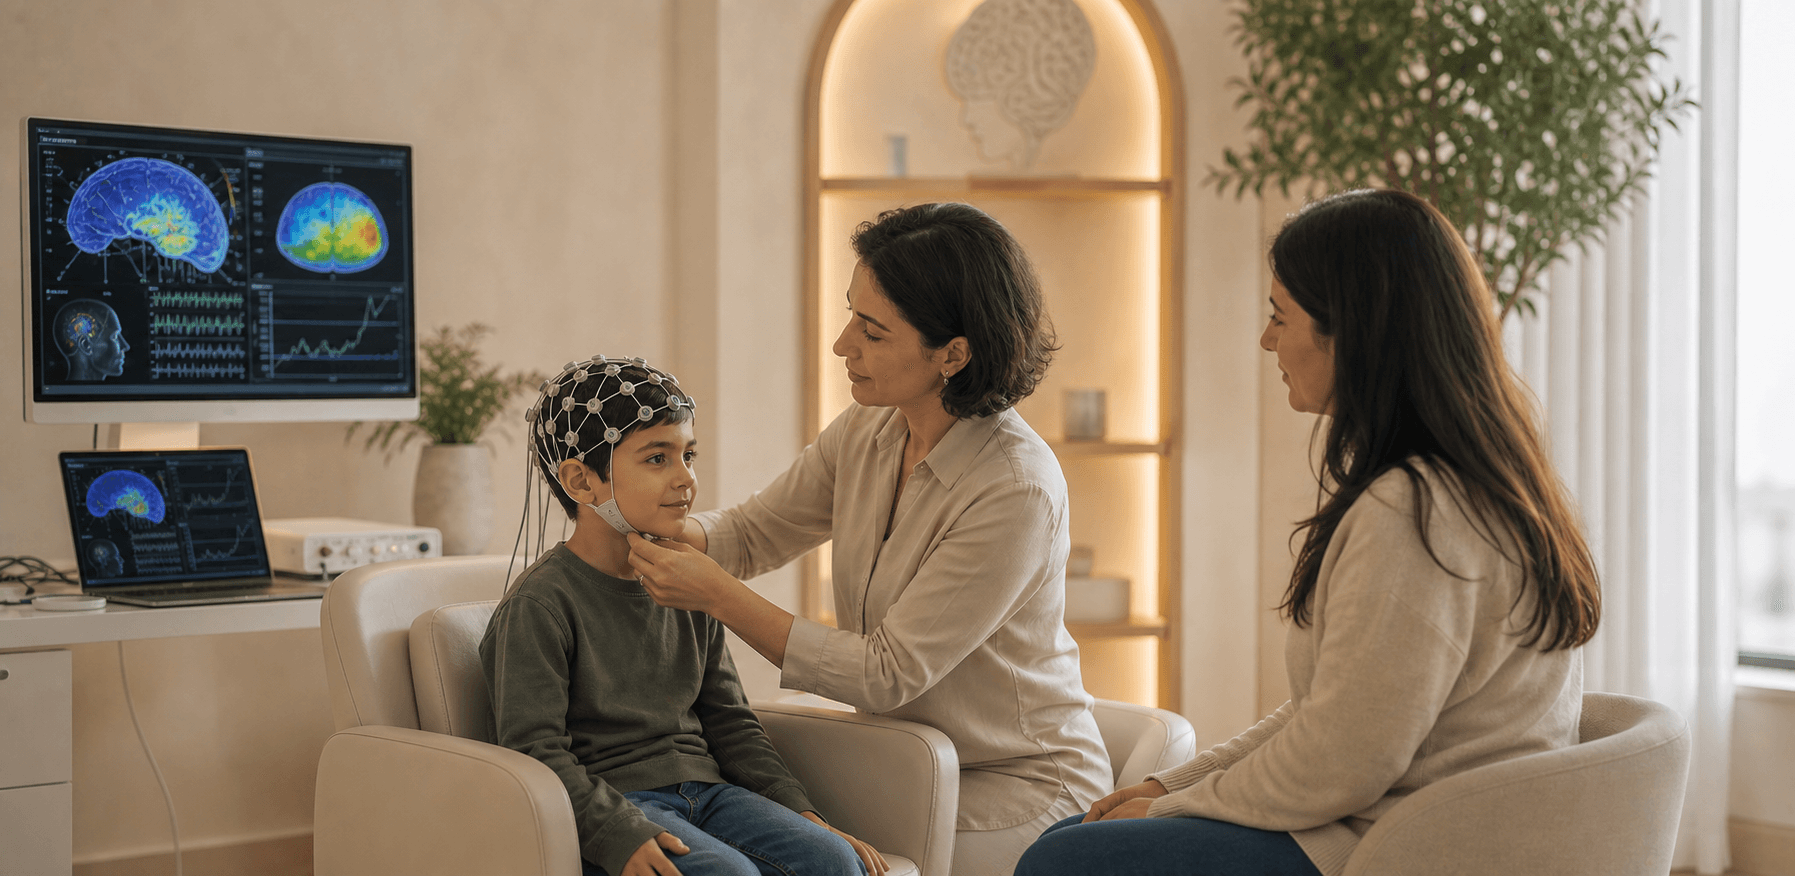
Brain mapping is presented here as a 3D map of the brain within functional neurology. It is used to visualize, in color, how different areas may be functioning in comparison with age-based reference data.
The mapping is compared with the scan of a person of the same age who does not present the same kind of difficulties. In this tradition, that reference comparison is often simply called the statistics. The difference between the child’s recording and that reference appears in color across the various brain regions.
For the therapist, this can offer an immediate view of which areas may appear weaker and may therefore deserve more attention or stimulation within the care plan. On that basis, the team may build a more precise and more objective therapeutic program rather than relying only on impression.
A new brain mapping may then be carried out about six months later so the team can study the difference over time. In this lineage, this repeated work is also linked to the desire to publish scientific studies that document the effects observed in practice.
The color display is used to help visualize which areas may be functioning more comfortably and which may appear less efficient in relation to the reference comparison.
If the team identifies weaker functional zones, those observations can help orient stimulation priorities and make the therapeutic plan more structured and objective.
Even when mapping is informative, it still needs to be read carefully and never replaces diagnosis, medication decisions, imaging, or pediatric neurology.
In this educational framework, clinicians may explain the main wave families in simple terms so parents are not left alone with technical vocabulary.
0.5 to 4 waves per second
These very slow waves are mainly active when a person is falling asleep and during sleep. They should therefore not be too dominant during the day, because excessive daytime dominance is described as slowing brain functioning and processing speed.
4 to 8 waves per second
Theta activity is associated here with fantasy, imagination, and dreaming. In everyday explanation, it is often presented as belonging to more inward or floating states of mind.
8 to 12 waves per second
Alpha waves are described as appearing when we are awake and calmly alert, allowing the senses to receive outside information more appropriately.
12 to 30 waves per second
These faster waves are linked to mental processes and higher concentration. In this framework, alpha and beta together are often described as the main working waves.